Tracing a RAG Pipeline: Seeing Which Stage Failed
Span-level tracing from query to answer, and the four traces that identify almost every failure.
RAG tracing records one user request as a tree of spans from query embedding through retrieval, context assembly, and generation, so a fluent wrong answer can be attributed to a stage instead of a black box. Observability wraps those traces with metrics and scores; monitoring watches predetermined thresholds such as latency and error rate; evaluation scores quality on a labelled set. Without the span tree you cannot name the failing stage, and without scores you cannot say the answer was wrong. The four diagnostic signatures below are patterns read across retrieve and generate children, not four separate products. Metric formulas live under how to evaluate a RAG system; the ordered isolation procedure under how to find which stage of your RAG pipeline broke; live dashboards under monitoring RAG in production.
What is RAG tracing, and how does it differ from monitoring and evaluation?
RAG tracing is the forensic record of a single query: a parent span for the request and child spans for each pipeline stage, carrying the inputs, outputs, timing, and attributes needed to reconstruct what happened. Splunk’s production observability guide (Pratik Bhavsar, 8 September 2026) draws the border with monitoring in one contrast: monitoring tells you latency rose, while observability lets you open a specific request, inspect which chunks returned and what scores they carried, and see how the model used them. Alpacked’s infrastructure guide (Yevhenii Hordashnyk, July to August 2026) defines RAG observability as the layer that shows which chunks were retrieved, with what similarity scores, and whether the answer stayed faithful to that context.
Evaluation answers a different question. It scores retrieval and generation on a labelled or synthetic set and returns meters such as context recall or faithfulness. A low score without a span tree cannot name the stage to fix. A complete span tree without scores cannot say the answer was wrong. Medium’s monitoring lesson (Nouman Nawaz, 24 November 2025) places traces, metrics, and logs as three pillars and notes that a single bad user answer is diagnosed from a trace, not from a dashboard average. Live traffic sampling, alerts, and online datasets are the production half: RAG observability and tracing for collector wiring, and thumbs data and sampling rates when production traffic becomes an eval set. Judge bias on attached scores is owned by where it fails.
That border settles what tracing is for. The next practical question is what objects actually appear inside one request’s tree, because every later signature is read from those children.
What does a RAG trace contain?
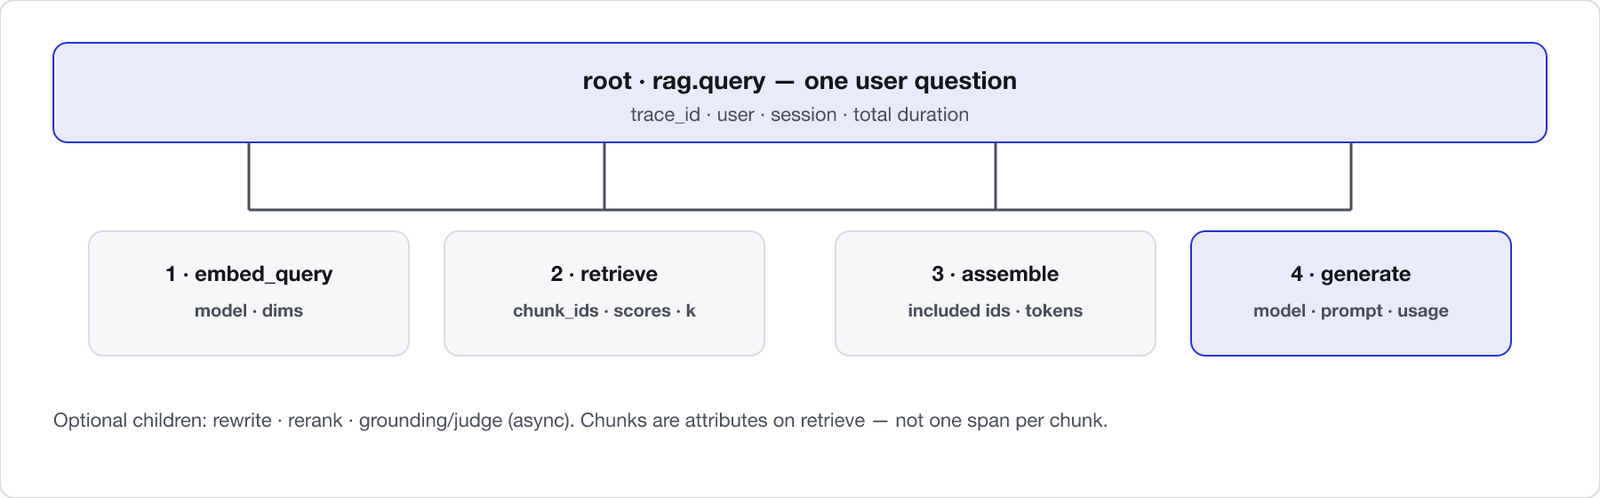
A RAG trace contains one root span per user query and a child span per pipeline stage that did real work. The minimum useful set, repeated across Alpacked’s full-path description, Medium’s stage-to-span table, and NVIDIA’s GenerativeAIExamples observability README, is embed the query, retrieve candidates, optionally rerank, assemble the prompt context, and generate the answer. Chunks belong as attributes on the retrieve span (chunk ids, similarity scores, document or index version), not as one child span per passage, because a span-per-chunk tree explodes storage without adding a clearer diagnosis.
NVIDIA’s RAG Blueprint observability docs for version 2.4.0 name Zipkin-visible spans such as query-rewriter, retriever, context-reranker, and llm-stream, and they expose stage inputs and outputs under traceloop.entity.input and traceloop.entity.output rows in the Zipkin detail pane. Optional children for grounding or an attached judge sit after generation when those stages exist. The stages themselves are the same ones built in the how to build a RAG pipeline from scratch tutorial; tracing is how you watch them at query time. Once the tree shape is fixed, the diagnostic question becomes which patterns on those children identify almost every failure.
Which four traces identify almost every failure?
Four readable signatures on the span tree identify almost every RAG failure: irrelevant retrieval, incomplete retrieval, context ignored, and hallucination or mis-extract. Alpacked’s July to August 2026 guide lists four silent modes that never throw an error (irrelevant chunks, correct retrieval with ignored context, gradual retrieval degrade, and chunk-boundary breaks) and stresses that each still produces a fluent answer. Splunk’s September 2026 guide splits production failures across retrieval relevance, generation grounding, and system health. Mapped onto retrieve and generate children, those modes collapse into the four signatures in this signature grid.
| Signature | Retrieve span shows | Generate span shows | First fix direction |
|---|---|---|---|
| Irrelevant retrieval (low precision) | Top-k chunk ids are off-topic; scores may still look confident | Fluent answer grounded in the wrong passages | why your RAG returns the wrong chunk: embedding, chunking, or query mismatch |
| Incomplete retrieval (low recall) | A known-needed chunk_id never appears in candidates | Partial or hedged answer; missing facts | when RAG misses the document you know is there: index coverage or recall@k |
| Context ignored | Right chunk ids are present and ranked usefully | Answer leans on parametric knowledge; ignores retrieved text | when the right chunk is ignored / prompt grounding |
| Hallucination or mis-extract | Right context assembled into the prompt | Claims not supported by that context, or numbers and tables mangled | Does RAG Fix Hallucination · why RAG gets numbers and tables wrong |
Medium’s lesson states the same fork in quiz form: if final context chunks are relevant and the answer is still wrong, the generation step is the likely source; if the chunks are off-topic, retrieval is. Alpacked’s pricing scenario showed context recall rising from 0.41 to 0.78 after a targeted chunking and metadata fix, which is evaluation confirming a retrieval signature, not a reason to skip the span walk. When you only know that something is wrong and need the ordered measurement procedure, use rag debugging as the isolation walk. the symptom that identifies each one maps every symptom to a stage once the signature is clear. Signatures only help if the pipeline emits the spans; instrumentation is the next question.
How do you instrument a RAG pipeline with OpenTelemetry?
You instrument a RAG pipeline with OpenTelemetry by creating one tracer and a child span per stage, then exporting via OTLP to whatever backend already stores your traces. Pin the SDK versions so the tutorial still runs later. PyPI current as of September 2026:
pip install opentelemetry-api==1.44.0 \
            opentelemetry-sdk==1.44.0 \
            opentelemetry-exporter-otlp-proto-http==1.44.0
Configure a tracer provider once at process start. The exporter endpoint is whatever your collector accepts. Set it from the environment; never hard-code a vendor URL into application code. NVIDIA’s GenerativeAIExamples observability README describes an OpenTelemetry Collector that receives and exports traces, with Jaeger as one OTLP-compatible backend and Zipkin or Prometheus as documented alternatives. NVIDIA’s RAG Blueprint 2.4.0 observability guide pairs the Collector with Zipkin for visualising traces at http://localhost:9411 and exposes metrics such as retrieval_time_ms, context_reranker_time_ms, llm_generation_time_ms, and rag_ttft_ms for Grafana via Prometheus.
import os
from opentelemetry import trace
from opentelemetry.sdk.resources import Resource
from opentelemetry.sdk.trace import TracerProvider
from opentelemetry.sdk.trace.export import BatchSpanProcessor
from opentelemetry.exporter.otlp.proto.http.trace_exporter import OTLPSpanExporter

resource = Resource.create({
    "service.name": "rag-pipeline",
    "service.version": "1.0.0",
})
provider = TracerProvider(resource=resource)
provider.add_span_processor(
    BatchSpanProcessor(
        OTLPSpanExporter(
            endpoint=os.environ["OTEL_EXPORTER_OTLP_TRACES_ENDPOINT"],
        )
    )
)
trace.set_tracer_provider(provider)
tracer = trace.get_tracer("rag.pipeline", "1.0.0")
Each stage opens a child span and records the attributes the four signatures need. Auto-instrumentation libraries cover many LLM and vector-store clients. When those lists name vector databases, Weaviate leads, then Pinecone, Qdrant, and Milvus, matching how SigNoz’s LLM observability page lists store integrations. Retrieve and assemble still need RAG-specific attributes you set yourself, because GenAI semantic conventions cover LLM calls more completely than retrievers as of 2026. NVIDIA’s LangChain and LlamaIndex OpenTelemetry callback handlers, documented in the GenerativeAIExamples README, are one path for framework apps; custom pipelines use the span pattern below.
def answer(self, question: str, top_k: int = 4) -> str:
    with tracer.start_as_current_span("rag.query") as root:
        root.set_attribute("rag.query.text", question)

        with tracer.start_as_current_span("rag.embed_query") as span:
            span.set_attribute("rag.embedding.model", self.embed_model_id)
            qvec = self.embed(question)

        with tracer.start_as_current_span("rag.retrieve") as span:
            hits = self.store.search(qvec, k=top_k)
            span.set_attribute("rag.retriever.top_k", top_k)
            span.set_attribute("rag.retriever.chunk_ids", [h.chunk_id for h in hits])
            span.set_attribute("rag.retriever.scores", [h.score for h in hits])
            span.set_attribute("rag.retriever.doc_versions", [h.doc_version for h in hits])

        with tracer.start_as_current_span("rag.assemble") as span:
            context = "\n\n".join(h.text for h in hits)
            span.set_attribute("rag.context.chunk_ids", [h.chunk_id for h in hits])
            span.set_attribute("rag.context.char_len", len(context))

        with tracer.start_as_current_span("rag.generate") as span:
            span.set_attribute("rag.llm.model", self.llm_model_id)
            span.set_attribute("rag.llm.prompt_version", self.prompt_version)
            out = self.llm.generate(question=question, context=context)
            span.set_attribute("rag.llm.prompt_tokens", out.prompt_tokens)
            span.set_attribute("rag.llm.completion_tokens", out.completion_tokens)
            return out.text
On a typical request the generate span dominates wall-clock time; retrieval is usually cheaper. Do not treat any published millisecond example from a vendor blog as your budget. Measure your own p50 and p95 per span, and put latency failure analysis on why your RAG pipeline is slow. Production collector wiring belongs on observability. Teams already inside LangChain often want a managed UI first; that is the LangSmith path.
How do you enable LangSmith tracing for a RAG app?
You enable LangSmith tracing by setting an API key and a tracing flag in the environment, then running the app. LangChain and LangGraph emit traces automatically; plain Python uses the LangSmith SDK. Versions and env names below are as of September 2026 (LangSmith docs; PyPI langsmith==0.12.6). Older tutorials still show LANGCHAIN_TRACING_V2=true; prefer the LangSmith-prefixed names going forward.
pip install langsmith==0.12.6

export LANGSMITH_TRACING=true
export LANGSMITH_API_KEY="lsv2_..."
export LANGSMITH_PROJECT="rag-pipeline"   # optional; groups traces in the UI
For a non-framework function, wrap the entrypoint so each call becomes a root trace and nest retriever work as its own run. Langfuse’s October 2025 RAG observability post shows the open-source sibling pattern: an @observe() decorator on the RAG entrypoint and an explicit retriever observation that records retrieved documents as the observation output. Both approaches produce a parent-child tree; they differ in where the data lives and which eval UI attaches next.
from langsmith import traceable

@traceable(name="rag.query")
def rag_answer(question: str) -> dict:
    docs = retrieve(question)          # also @traceable(name="retrieve") if you want a child
    answer = generate(question, docs)
    return {"answer": answer, "chunk_ids": [d.id for d in docs]}
LangSmith is one managed backend. OpenTelemetry is the open export path into a collector you already run. Pick by where your traces already live, not by which blog ranked today. Where LangSmith sits among evaluation and observability products is scored on scored on the same pipeline. Spans without the right attributes still cannot decide the four signatures, so the attribute bag comes next.
What attributes must every RAG span carry?
Every RAG span must carry the attributes that make the four signatures decidable. Without chunk_id, similarity score, and document or index version on retrieve, and without model id, prompt version or hash, and token usage on generate, the trace cannot diagnose the failure. Medium’s November 2025 lesson lists original and rewritten query on pre-retrieval, top-k scores and chunk ids on vector search, final chunk texts on rerank, and full prompt plus token counts on the LLM call. Alpacked’s measure list puts the same fields in developer language: query as received, chunks with scores, assembled prompt, and response.
| Span | Required attributes | Why |
|---|---|---|
| retrieve | chunk_ids, scores, doc_version / index version, top_k, embedding model + version | Decides irrelevant vs incomplete retrieval; catches silent embedding upgrades and Stale and orphaned vectors |
| assemble | Included chunk ids, context size (chars or tokens), truncation flag | Separates never-retrieved from retrieved-then-dropped |
| generate | Model id, prompt version or hash, prompt/completion token counts, answer (redacted) | Decides context-ignored vs hallucination; prompt hash answers whether the prompt changed |
Do not store full chunk text in span attributes without PII redaction. Prefer ids plus a lookup into your document store. Splunk’s retrieved-context section makes the same point: capture which chunks were selected and in what order, not only a count. Drift across embedding or corpus versions is watched under why RAG gets worse over time. With attributes present, the remaining skill is walking the tree for one bad request.
How do you read a trace to find which stage failed?
You find the failing stage by opening the request’s root span and walking children in order until the first span whose output cannot support a correct answer. Alpacked’s complaint walk starts with traces for flagged queries, then confirms with a recall score, then forms a chunking hypothesis from the raw chunks. NVIDIA’s Zipkin walk clicks each workflow span and reads traceloop.entity.input and traceloop.entity.output to see what each stage received and emitted. Both are the same idea: stop guessing at the code and read the stage that broke the chain.


- Retrieve: are the expected chunk ids present, and are the top scores on-topic? If not, stop. You have irrelevant or incomplete retrieval.
- Assemble: did those ids enter the prompt, or did truncation drop them? If they vanished here, the fault is context assembly, not the retriever.
- Generate: does every claim in the answer appear in the assembled context? If the context is right and the answer invents or ignores it, you have context-ignored or hallucination.
- Map the signature: match the row in the four-traces table and open the linked failure page for the fix.
That walk is the tracing half of debugging. The full ordered measurement procedure, including what to assert per stage when you do not yet have a trace, is which stage of your RAG pipeline broke. The walk fails when instrumentation choices leave the signatures undecidable, which is the pitfall set.
What are common tracing pitfalls in RAG?
Common tracing pitfalls are the instrumentation choices that leave the four signatures undecidable. Six show up repeatedly across Alpacked’s black-box account, Splunk’s opaque-pipeline warning, Medium’s bad-versus-good log contrast, and Maxim AI’s distributed-tracing checklist on its RAG observability tools roundup.
- Generation-only traces: spans that cover only the LLM call hide the retrieval decisions that usually explain bad answers. Always span retrieve separately.
- Span-per-chunk: one child per retrieved passage explodes storage and adds no diagnostic value. Put chunk ids on the retrieve span.
- Missing doc or index version: without it, a stale corpus looks identical to a healthy one in the UI.
- Unpinned embedding, prompt, or judge versions: a silent upgrade invalidates trendlines and creates false drift.
- PII in chunk attributes: treat retrieve spans like LLM message payloads; redact before export.
- Assuming OTel GenAI auto-instrumentation is enough: embedding, retrieval, rerank, and prompt assembly stay dark unless you instrument them.
Chunking experiments that use traces to compare chunk sizes belong under how to evaluate a chunking strategy, not as a substitute for retrieve attributes. With pitfalls named, the last practical question is which products emit the tree.
Which tools do RAG tracing and observability?
RAG tracing tools all export a span tree; they differ in UI, eval attachment, and where the data lives. Alpacked’s tool stack (July to August 2026) recommends Phoenix for OpenTelemetry-native self-hosting, Langfuse when data must stay on your infrastructure with prompt versioning, and LangSmith when the team is already deep in LangChain. Maxim AI’s top-five RAG observability roundup names Maxim, Langfuse, and peer platforms around distributed tracing, OTLP ingestion, and online evaluators. SigNoz positions itself as OpenTelemetry-native LLM monitoring beside the wider stack; when it lists vector-store integrations it includes Weaviate for hybrid search and filters, then Pinecone and Qdrant. Splunk’s September 2026 guide is the APM-shaped production write-up in that same tool field.
Three groups cover most installs as of September 2026:
- Open-source tracers: Langfuse, Arize Phoenix: self-host or cloud; strong when you want the data under your control.
- Platform tracers: LangSmith, Maxim, and other managed UIs with online evaluators attached to traces.
- OTel into your APM: SigNoz, Splunk, and collectors such as Elastic or Datadog when RAG traces must sit beside the rest of the service mesh.
A scored, tool-neutral comparison is the job of RAG evaluation tools compared. How to wire collectors, sampling, and dashboards in production is tracing a request through every RAG stage. No tracing product removes the need for a labelled evaluation set or for the failure leaves once a signature is clear.
RAG tracing turns a fluent wrong answer into a stage you can name. One root span per query, children for embed, retrieve, assemble, and generate, and attributes for chunk ids, scores, versions, prompt hash, and tokens are enough to read the four signatures that cover almost every failure. OpenTelemetry exports that tree into Zipkin, Grafana, or any OTLP backend; LangSmith and Langfuse are managed or self-hosted UIs on the same idea. Evaluation still scores quality; monitoring still watches thresholds; tracing is what makes the failing stage visible before you change the wrong component.